Sketches for an AR Workflow Visualisation
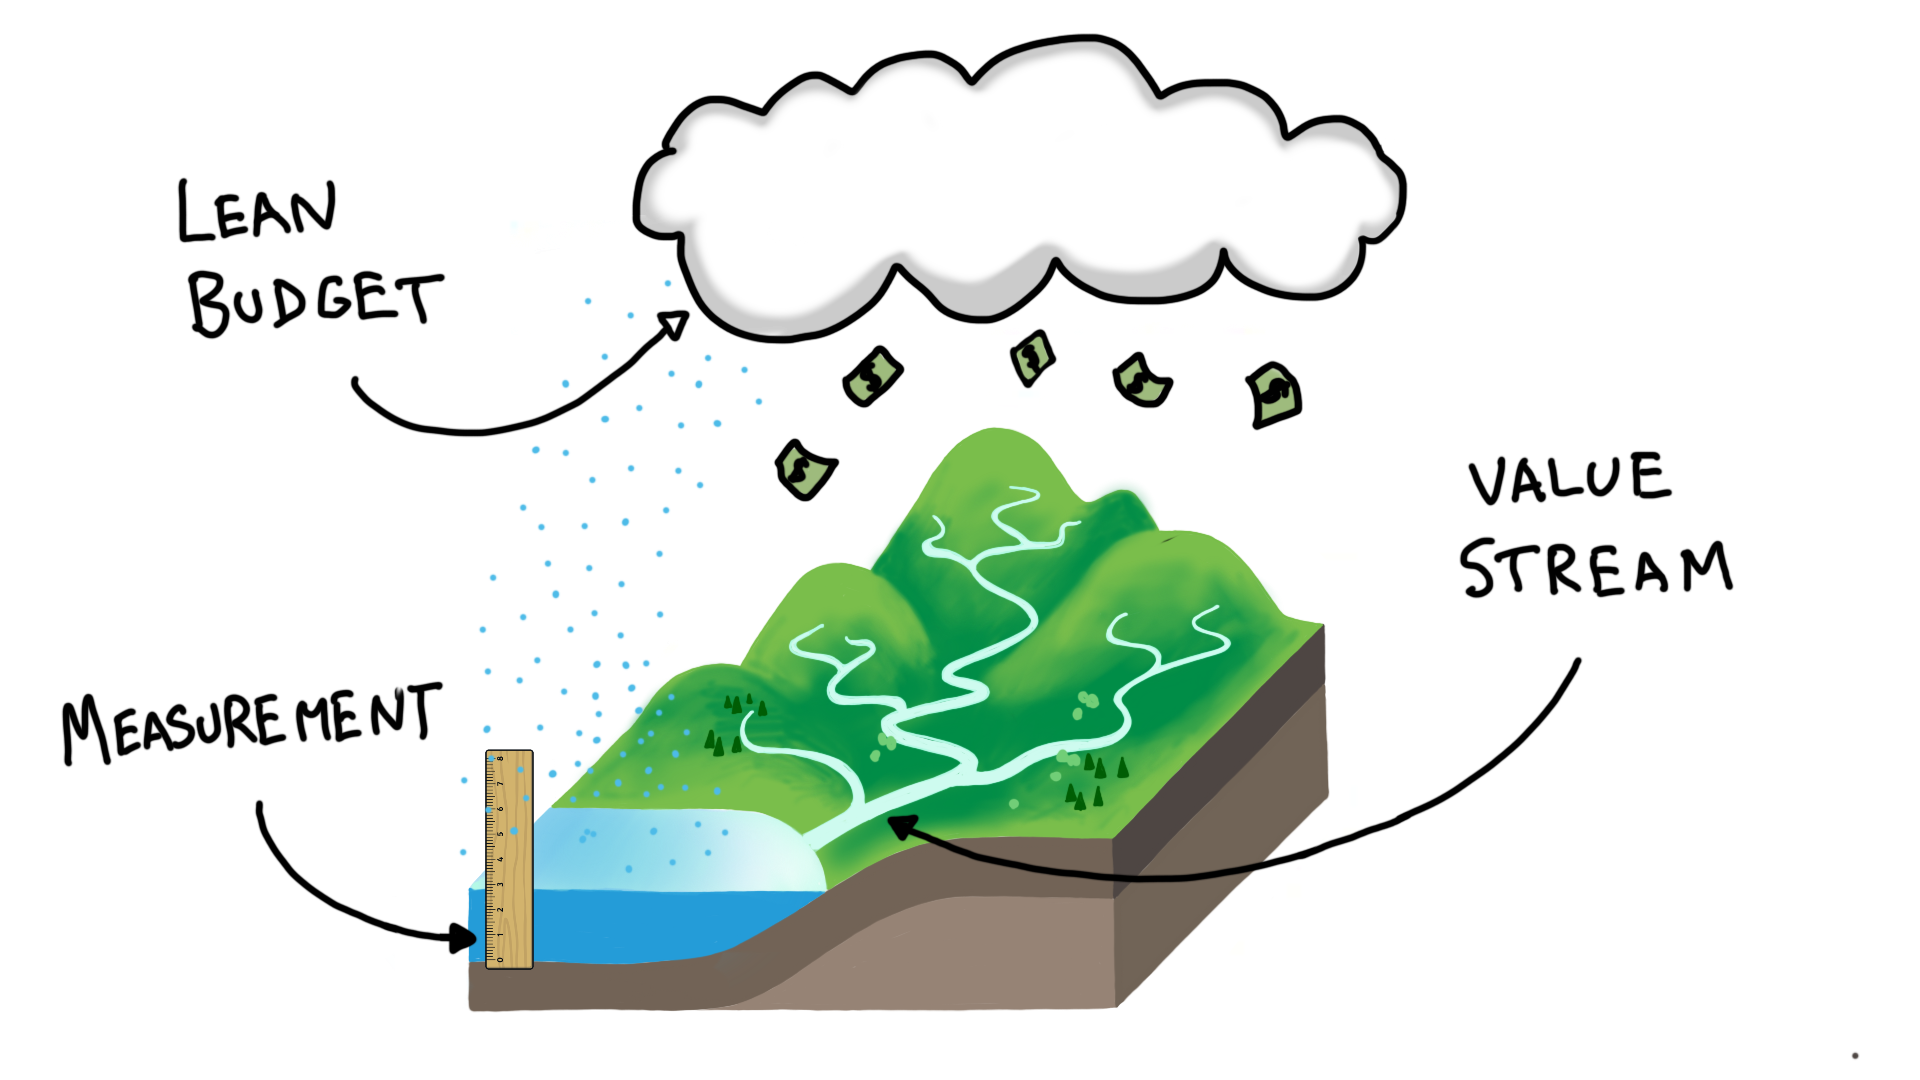
I’ve been drawing value streams using this water cycle image for a while. The idea is that value flows down and accumulates in the lake at the bottom, where it is measured. The measurement unlocks funding in the form of a “lean budget” (SAFe terminology) that replenishes the cycle.
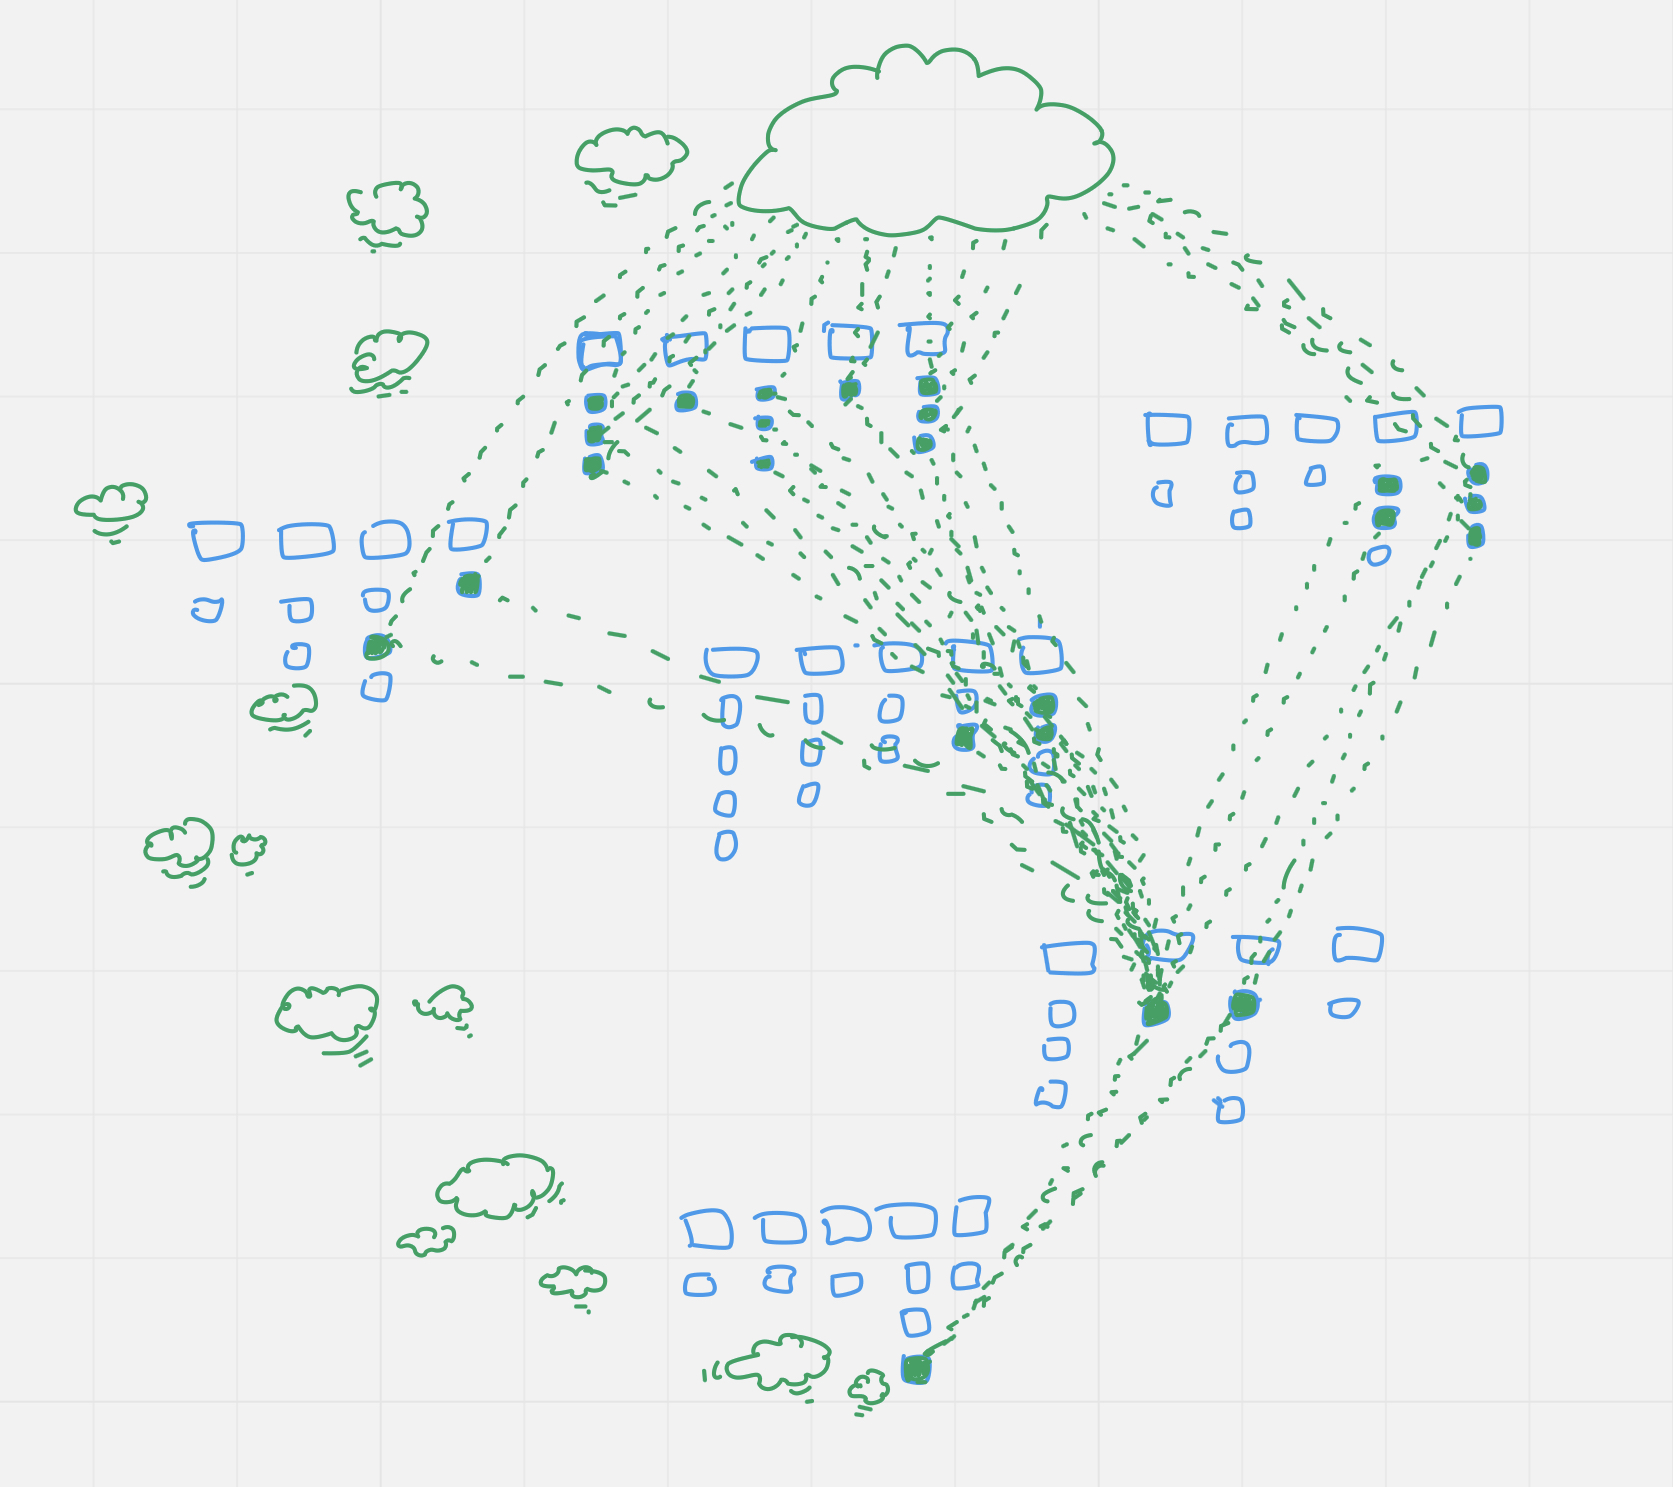
I had the idea that it is possible to visualise a large, complex value stream using linked kanban boards, In a large kanban system, one team’s board is a card on someone else’s board. If you think of this from the perspective of control - or with a “cost accounting” mindset - then control (of budgets, decisions etc.) flows down from the top (portfolio level) to the bottom (teams delivering, say, software features).
However, if you think in terms of value, the flow is reversed. You could think of value as flowing _up_ but that would be unnecessary - why not simply flip the heirarchy so that the delivery teams are up the top and the value flows down like water. Then you have a version of the water cycle with kanban boards (as I drew above in Miro).
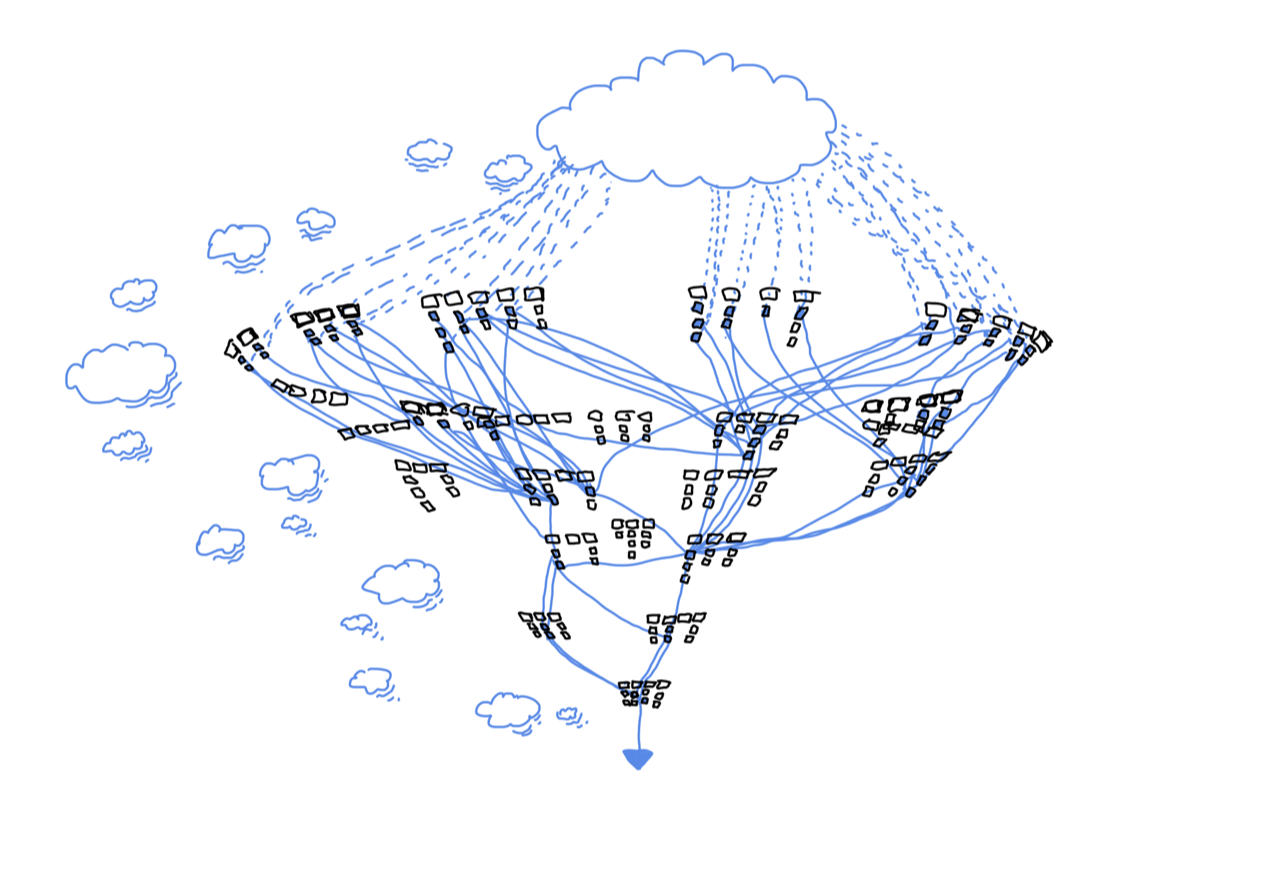
The last sketch I did in Procreate is a 3D conical formation of kanban boards that is designed to be navigated in AR - yes, like Minority Report.